01
Collect
Capture
GPS, survey, remote sensing and digitising.
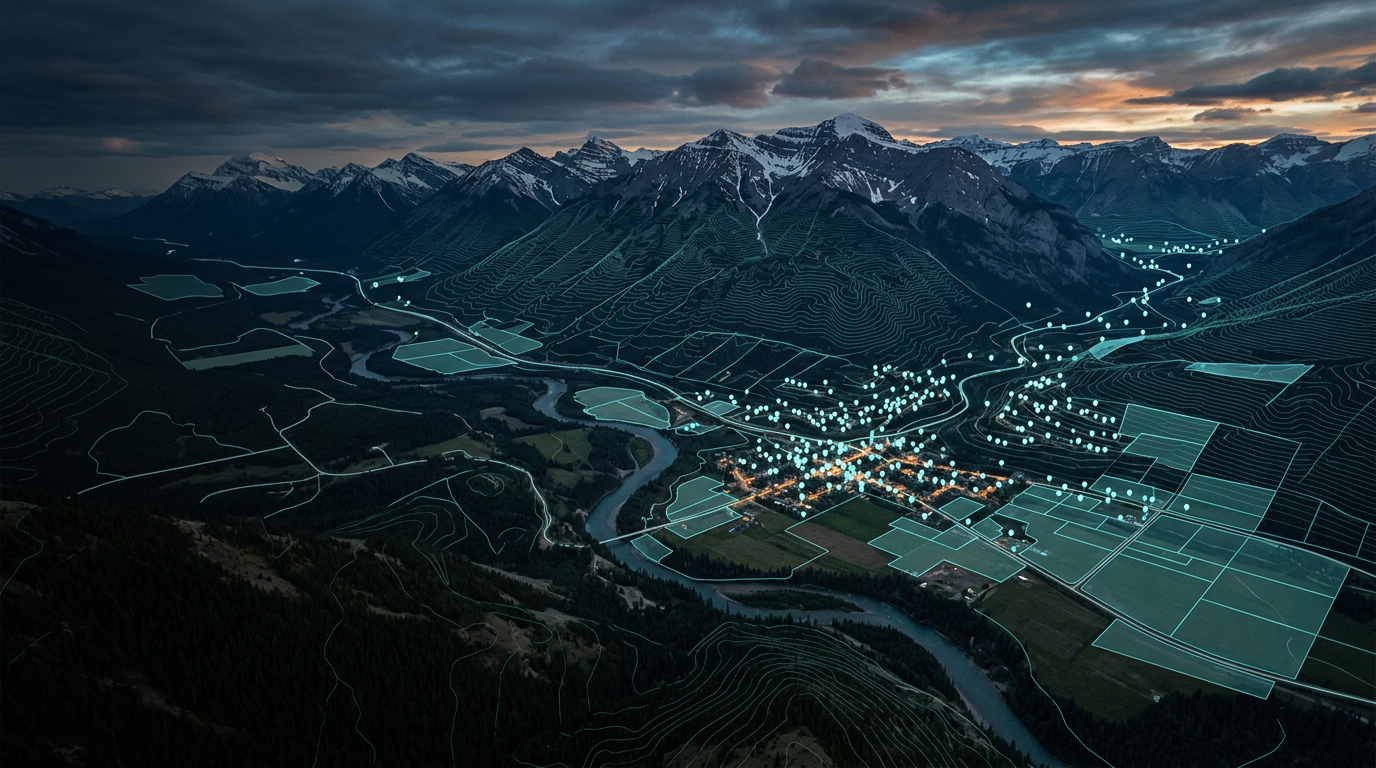
Geographic Information Systems (GIS)
How points, lines and polygons become a living model of the world.
What is GIS
A Geographic Information System is a framework for capturing, storing, managing, analysing and visualising data tied to locations on Earth.
It links where (coordinates) with what (attributes), so patterns, relationships and change can be seen and measured.
From Point to Volume
Each primitive adds one dimension to the last.
A single coordinate pair.
An ordered sequence of points, with length.
A closed ring of lines enclosing an area.
A polygon given height, or a surface given depth.
Two data models
| Model | What it stores | Best for | Formats |
|---|---|---|---|
| Vector Points, lines, polygons | Discrete features | Precise boundaries | Shapefile, GeoJSON, GeoPackage |
| Raster Grid of cells | A continuous grid; each cell holds a value | Elevation, imagery, temperature | GeoTIFF, COG |
Overlay
GIS overlays thematic layers on a shared coordinate reference system (CRS), so every layer lines up with the others.
Common choices: WGS 84 · EPSG:4326 Web Mercator · EPSG:3857
Core operations
01
Collect
GPS, survey, remote sensing and digitising.
02
Keep
Spatial databases such as PostGIS.
03
Ask
04
Show
2D maps, 3D scenes and dashboards.
Where GIS is used
Zoning, land use and growth scenarios.
Habitats, emissions and change over time.
Routes, networks and fleet movement.
Field boundaries, soils and crop monitoring.
Hazard zones, damage and access routes.
Pipes, cables and asset networks.
Open-source toolkit